IIEC Successfully Implements the Largest Energy Efficiency Project in the South Pacific

Under the Pacific Alliance for Sustainability (PAS) program of the Global Environment Facility (GEF), the Asian Development Bank (ADB) provided technical assistance for the “Promoting Energy Efficiency in the Pacific (PEEP)” project. The project was co-financed by the GEF, Government of Australia, Japan International Cooperation Agency (JICA) and the Asian Clean Energy Fund (under the Clean Energy Financing Partnership Facility). During the implementation phase (PEEP2) from 2011 to 2015, the International Institute for Energy Conservation (IIEC) established policy and implementation frameworks, developed energy efficiency targets, and implemented a range of energy efficiency (EE) projects in the five participating Pacific Developing Member Countries (PDMCs): PNG, Vanuatu, Tonga, Samoa, and the Cook Islands. The overall goal of the project was to reduce energy consumption in the residential, commercial and public sectors in order to save energy, reduce fossil fuel imports, and lower greenhouse gas (GHG) emissions.
Total Investment
US$ million2.68Energy Savings
MWh3,377/per yearCost Savings
US$ million1.51/per yearCO2 Savings
tons3,204/per year
Under PEEP2, IIEC implemented 34 EE projects following ADB procurement guidelines. Grant funding from the GEF was provided for the procurement of EE equipment, while the installation costs were covered through co-funding from the recipients (e.g., hotels, government agencies). With a total investment of US$ 2,686,637, the project resulted in energy annual savings of 3,377 MWh, annual cost savings of US$1,519,629 and CO2 savings of 3,204 tons/year. The average cost of saved energy across these projects varied from 3 to 11 cents/kWh—extremely cost-effective in comparison with the electricity tariffs in the PDMCs, which range between 29 and 61 cents/kWh.
Implementation of 34 Energy Efficiency Projects in PEEP2 Project
All Countries
1project(s)
Cook Islands
9project(s)
Papua New Guinea
5project(s)
Samoa
7project(s)
Tonga
5project(s)
Vanuatu
7project(s)
Project outcomes also included:
· Development of an energy use database to provide access to information on electricity consumption and energy efficiency indicators at national and end-use sector levels.
· Development of national EE targets for the five PDMCs based on energy consumption and end-use energy savings projections for three policy scenarios – conservative, moderate and aggressive – for the years 2020, 2025 and 2030.
· Development of guidelines to support EE best practices, including an Energy Efficiency Technology Assessment; International Best Practices for Energy Efficiency Building Codes; a Green Hotels Rating Scheme for the Pacific; a Green Commercial Buildings Rating Scheme for the Pacific; Energy Efficiency Assessment Guidelines, Framework and Scorecard; and EE Guidelines for Hotels, Commercial Buildings and Street Lighting.
· Conduct of a comprehensive energy audit training in all five PDMCs, which included intermediate and advanced energy auditing, practical on-site training and preparation of Investment Grade Audit Reports.
· Preparation of a series of “Energy Saving Tips” for printing on the back of electricity bills and “Home Energy Guides” providing information on electricity costs for common electrical appliances (both efficient and inefficient) customized to each PDMC.
The PEEP2 guidelines, templates and implementation models would be suitable for scaling up EE implementation throughout the Pacific region.
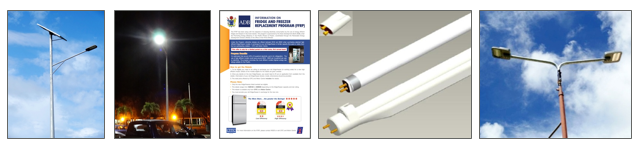
Table: Project Cost and Savings by Country
|
Country |
Cost of Equipment (US$) |
Cost of Installation (US$) |
Total Cost (US$) |
Annual Energy Savings (kWh/year) |
Annual Energy Cost Savings (US$/year) |
Annual Diesel Savings (litres/year) |
Annual CO2 Savings (tCO2e/year) |
|
Cook Islands |
616,582 |
148,780 |
765,362 |
525,223 |
320,386 |
153,312 |
471 |
|
PNG |
316,978 |
179,851 |
496,829 |
428,384 |
122,518 |
108,190 |
685 |
|
Samoa |
349,895 |
170,409 |
520,304 |
919,381 |
413,550 |
250,987 |
711 |
|
Tonga |
261,478 |
136,534 |
398,012 |
638,924 |
230,013 |
109,973 |
582 |
|
Vanuatu |
311,950 |
138,181 |
450,131 |
864,595 |
433,162 |
249,001 |
706 |
|
All ** |
55,599 |
- |
55,599 |
- |
- |
- |
- |
|
Total |
1,912,482 |
773,755 |
2,686,237 |
3,376,507 |
1,519,629 |
871,463 |
3,204 |
** Lamp Waste Treatment Equipment
Project Summary by Country
· Cook Islands
|
Project |
Energy Efficient Technology |
Total Project Cost (US$) |
Annual Energy Savings (MWh) |
Annual GHG Reductions (tCO2e) |
Average Tariff (US$/kWh) |
Annual Energy Cost Savings (US$) |
Lifetime Energy Savings (MWh) |
Lifetime GHG Reductions (tCO2e) |
Cost Per Lifetime Saving (US$/ kWh) |
Cost/Lifetime GHG Saving (US$/ tCO2e) |
Simple Payback (Years) |
|
EE Lighting in Airport |
Solar LED |
36,520 |
8.2 |
6.7 |
0.61 |
4,972 |
163 |
134 |
0.22 |
273 |
7.3 |
|
EE Lighting in Market ** |
Solar LED |
108,510 |
7.3 |
6.6 |
0.61 |
4,423 |
145 |
132 |
0.75 |
822 |
24.5 |
|
Refrigerator Program |
Efficient Fridge/Freezers |
113,150 |
83.3 |
66.4 |
0.61 |
50,803 |
833 |
664 |
0.14 |
170 |
2.2 |
|
EE Lighting in Port ** |
Solar LED |
108,125 |
8.6 |
6.9 |
0.61 |
5,267 |
173 |
138 |
0.63 |
784 |
20.5 |
|
EE Measures in the Public Buildings |
T-5 Lamps |
121,080 |
197.0 |
176.0 |
0.61 |
120,140 |
1,970 |
1,760 |
0.06 |
69 |
1.0 |
|
EE in Hotels and Commercial Buildings |
Inverter Acs, Insulation |
148,808 |
57.6 |
94.9 |
0.61 |
35,128 |
576 |
949 |
0.26 |
157 |
4.2 |
|
EE Lighting in Residential Sector |
T-5 Lamps |
72,331 |
141.8 |
95.0 |
0.61 |
86,498 |
2,836 |
1,900 |
0.03 |
38 |
0.8 |
|
EE Street Lighting in Outer Islands |
LED Street Lights |
24,410 |
4.7 |
4.0 |
0.61 |
2,855 |
35 |
30 |
0.70 |
814 |
8.6 |
|
EE Measures in the Hospital |
Solar Water Heaters |
32,428 |
16.9 |
14.0 |
0.61 |
10,302 |
169 |
140 |
0.19 |
232 |
3.1 |
|
Totals |
765,362 |
525 |
471 |
N/A |
320,386 |
6,899 |
5,847 |
0.11 |
131 |
2.4 |
|
** Scope was higher than base case
· Papua New Guinea
|
Project |
Energy Efficient Technology |
Total Project Cost (US$) |
Annual Energy Savings (MWh) |
Annual GHG Reductions (tCO2e) |
Average Tariff (US$/kWh) |
Annual Energy Cost Savings (US$) |
Lifetime Energy Savings (MWh) |
Lifetime GHG Reductions (tCO2e) |
Cost Per Lifetime Saving (US$/ kWh) |
Cost/Lifetime GHG Saving (US$/ tCO2e) |
Simple Payback (Years) |
|
EE Street Lighting |
LED Street Lighting |
63 ,899 |
36.7 |
26.5 |
0.286 |
10,490 |
275 |
199 |
0.23 |
322 |
6.1 |
|
EE Lighting in Government Sector |
T-5 Lamps |
174 ,428 |
218.2 |
535.0 |
0.286 |
62,402 |
2,182 |
5,350 |
0.08 |
33 |
2.8 |
|
EE Street Lighting |
LED Street Lighting |
85 ,800 |
46.0 |
45.0 |
0.286 |
13,163 |
345 |
338 |
0.25 |
254 |
6.5 |
|
EE Lighting in Hospital |
T-5 Lamps and sensors |
87 ,817 |
43.9 |
27.0 |
0.286 |
12,557 |
439 |
270 |
0.20 |
325 |
7.0 |
|
EE Lighting in Government Sector |
T-5 Lamps and sensors |
84 ,885 |
83.6 |
51.0 |
0.286 |
23,906 |
836 |
510 |
0.10 |
166 |
3.6 |
|
Totals |
496,829 |
428 |
685 |
N/A |
122,518 |
4,077 |
6,666 |
0.12 |
75 |
4.1 |
|
· Samoa
|
Project |
Energy Efficient Technology |
Total Project Cost (US$) |
Annual Energy Savings (MWh) |
Annual GHG Reductions (tCO2e) |
Average Tariff (US$/kWh) |
Annual Energy Cost Savings (US$) |
Lifetime Energy Savings (MWh) |
Lifetime GHG Reductions (tCO2e) |
Cost Per Lifetime Saving (US$/ kWh) |
Cost/Lifetime GHG Saving (US$/ tCO2e) |
Simple Payback (Years) |
|
EE Street Lighting |
LED Street Lights |
114,222 |
45.0 |
36.2 |
0.45 |
20,250 |
338 |
272 |
0.34 |
421 |
5.6 |
|
EE Lighting in Government Buildings |
T-5 Lamps |
50,124 |
406.0 |
324.7 |
0.45 |
182,700 |
2,761 |
2,208 |
0.02 |
23 |
0.3 |
|
EE Luminaires in Government Buildings |
T-5 Luminaires |
93,438 |
86.0 |
68.1 |
0.45 |
38,700 |
860 |
681 |
0.11 |
137 |
2.4 |
|
Air Conditioning - Government Buildings |
Inverter A/Cs |
88,435 |
80.0 |
77.3 |
0.45 |
36,000 |
800 |
773 |
0.11 |
114 |
2.5 |
|
Solar Hybrid A/C |
|||||||||||
|
Smart Controllers |
|||||||||||
|
EE Lighting in Commercial Buildings |
T-5 Lamps |
71,440 |
127.0 |
101.9 |
0.45 |
57,150 |
864 |
693 |
0.08 |
103 |
1.3 |
|
Air Conditioning - Hotels |
Inverter A/Cs |
33,610 |
20.0 |
15.8 |
0.45 |
9,000 |
200 |
158 |
0.17 |
213 |
3.7 |
|
EE Lighting in Households |
T-5 Lamps |
69,035 |
155.0 |
123.6 |
0.45 |
69,750 |
3,100 |
2,472 |
0.02 |
28 |
1.0 |
|
Totals |
520,304 |
919 |
711 |
N/A |
413,550 |
8,922 |
7,256 |
0.06 |
72 |
1.3 |
|
· Tonga
|
Project |
Energy Efficient Technology |
Total Project Cost (US$) |
Annual Energy Savings (MWh) |
Annual GHG Reductions (tCO2e) |
Average Tariff (US$/kWh) |
Annual Energy Cost Savings (US$) |
Lifetime Energy Savings (MWh) |
Lifetime GHG Reductions (tCO2e) |
Cost Per Lifetime Saving (US$/ kWh) |
Cost/Lifetime GHG Saving (US$/ tCO2e) |
Simple Payback (Years) |
|
EE Street Lighting for Outer Islands |
LED Street Lights |
90 ,968 |
45.2 |
41.0 |
0.36 |
16,268 |
339 |
308 |
0.27 |
296 |
5.6 |
|
EE Street Lighting for Tongatapu |
LED Street Lights |
77 ,363 |
52.0 |
47.0 |
0.36 |
18,731 |
390 |
353 |
0.20 |
219 |
4.1 |
|
Residential EE Lighting in the Outer Islands |
T-5 Lamps |
83 ,939 |
233.5 |
213.0 |
0.36 |
84,072 |
4,671 |
4,260 |
0.02 |
20 |
1.0 |
|
EE Lighting in Public Sector Buildings |
T-5 Lamps |
71 ,783 |
158.7 |
144.7 |
0.36 |
57,134 |
1,587 |
1,447 |
0.05 |
50 |
1.3 |
|
Residential EE Lighting in Tongatapu |
T-5 Lamps |
73 ,958 |
149.5 |
136.0 |
0.36 |
53,808 |
2,989 |
2,720 |
0.02 |
27 |
1.4 |
|
Totals |
398 , 012 |
639 |
582 |
N/A |
230,013 |
9,976 |
9,087 |
0.04 |
44 |
1.7 |
|
· Vanuatu
|
Project |
Energy Efficient Technology |
Total Project Cost (US$) |
Annual Energy Savings (MWh) |
Annual GHG Reductions (tCO2e) |
Average Tariff (US$/kWh) |
Annual Energy Cost Savings (US$) |
Lifetime Energy Savings (MWh) |
Lifetime GHG Reductions (tCO2e) |
Cost Per Lifetime Saving (US$/ kWh) |
Cost/Lifetime GHG Saving (US$/ tCO2e) |
Simple Payback (Years) |
|
EE Air Conditioning |
VRF |
68,673 |
14.4 |
11.5 |
0.501 |
7,214 |
144 |
115 |
0.48 |
597 |
9.5 |
|
EE Lighting in Public Sector Buildings |
T-5, LED and CFLs |
95,199 |
122.0 |
101.0 |
0.501 |
61,122 |
1,220 |
1,010 |
0.08 |
94 |
1.6 |
|
EE Street Lighting in Luganville |
LED Street Lights |
64,775 |
36.2 |
34.0 |
0.501 |
18,126 |
271 |
255 |
0.24 |
254 |
3.6 |
|
Residential EE Lighting, Luganville |
T-5 Lamps |
46,668 |
136.0 |
112.0 |
0.501 |
68,136 |
2,720 |
2,240 |
0.02 |
21 |
0.7 |
|
EE Street Lighting in Port Vila |
LED Street Lights |
65,575 |
46.0 |
24.0 |
0.501 |
23,054 |
345 |
180 |
0.19 |
364 |
2.8 |
|
Residential EE Lighting, Port Vila |
T-5 Lamps |
56,478 |
319.0 |
264.0 |
0.501 |
159,819 |
6,380 |
5,280 |
0.01 |
11 |
0.4 |
|
EE Lighting for Provincial Buildings and Schools |
T-5 Lamps |
52,763 |
191.0 |
159.0 |
0.501 |
95,691 |
1,910 |
1,590 |
0.03 |
33 |
0.6 |
|
Totals |
450,131 |
865 |
706 |
N/A |
433,162 |
12,990 |
10,670 |
0.03 |
42 |
1.0 |
|