EXECUTIVE SUMMARY
 The nonprofit sector has historically been overlooked by energy management programs. Energy Savings for Nonprofits (ESFN) was one of the country’s first state-sponsored energy conservation programs offered specifically for day care centers, food banks, senior centers, health care centers, family shelters, and other human service nonprofit agencies. The state of Washington contains about 1,200 human service agencies. A 1987 study found that 92% of these spent approximately 20% of their operating budgets on energy.
The Washington State Energy Office (WSEO) in cooperation with Seattle City Light, Tacoma Public Utilities, and Snohomish County PUD, designed the ESFN program in 1987 to reduce operating costs for nonprofit organizations. By using fluorescent lights, wrapping hot water tanks, caulking windows, and installing other energy efficiency measures, WSEO knew that nonprofits could greatly reduce their energy bills and thus enhance and even expand their services. The ultimate goal of the ESFN program is to have nonprofit agencies spending their money on human services instead of energy-inefficient buildings.
The program provides a combination of technical, financial, and educational assistance. Fuel-blind energy audits are performed, typically by the local utility. Based on the audits, efficiency measures are recommended. The nonprofit chooses which measures to install, and after successful completion of the retrofit an inspection occurs prior to WSEO’s reimbursement of applicable costs.
Over the program’s history a number of funding requirements have been used. For instance, initially grants of $4,500 were offered in select counties for buildings of 5,000 square feet or larger, $2,000 for buildings less than 5,000 square feet, and no-interest loans were available up to $30,000. In 1993, ESFN was budgeted to provide grants of up to $20,000 requiring a 50% match. Large fluctuations in the grant and loan amounts offered each year have been due to the different amounts of money received by WSEO from the oil overcharge funds, the principal source of funding for the program.
Through November 19, 1992, 175 nonprofit human service agencies had completed projects through the ESFN program. Annual electric energy savings for the program total 5,255 MWh. Electric energy savings per participant were greatest in FY 1991 with 88,073 kWh saved and lowest in FY 1989 at 21,383 kWh.
The costs of the retrofits that have resulted from the ESFN program are borne by three different parties: WSEO, participating utilities, and the actual nonprofit organizations. All these costs combine to create gross program costs over the lifetime of the program of $1,854,700. WSEO expenditures are made up of grants and administrative costs and total $917,800. The utilities’ share of the program costs (in grants only) total $602,300. Customer contributions (which includes loans) have totalled $334,600.
[CLICK HERE TO DOWNLOAD THE ENTIRE 17 PAGE PROFILE IN PDF FILE FORMAT]
This profile was produced by 

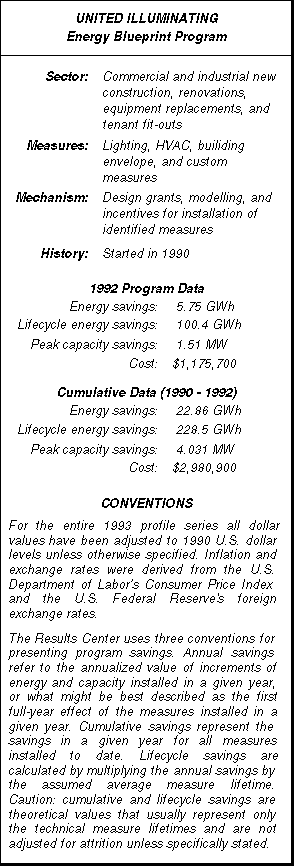
 United Illuminating’s (UI) Energy Blueprint program offers financial incentives to commercial, industrial, and institutional customers who incorporate select energy-efficiency measures into the design of their new buildings, major renovations, tenant build-outs, and equipment replacement projects, as well as efficient process equipment installations. For customers who install a comprehensive set of specified program measures, additional incentives are offered. Grants are also available to cover design fees and building commissioning.
 Duct testing and repair is one of the most exciting new areas for potentially huge energy savings. Recent studies and pilot programs show that these savings can be realized in southern and northern latitudes... and that the per home savings can be as high as 8-10% of total household energy use, or as much as 10-15% of household electrical use. In short, duct testing and repair represents one of the newest and largest gold mines for residential energy savings.
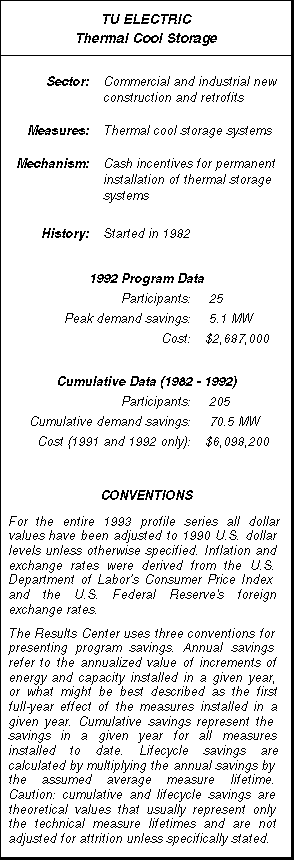
 TU Electric leads the nation’s utilities in the number of customers using thermal cool storage with 205 systems installed to date. The Thermal Cool Storage program was the first nonresidential DSM program offered by the utility, beginning full-scale in 1982. When this program began there were only three utilities in the United States offering incentives for installing thermal storage systems.